
If You’re Not Using Salesforce Dashboards, You’re Missing Out!
Let’s talk about Dashboard fun in Salesforce!
Dashboard fun? What does that mean?
I often go into different nonprofit client systems and find that they don’t have dashboards set up. It’s a little perplexing because one of the most fun and exciting pieces (at least to me anyway) about putting all of this data into Salesforce is being able to visually see that data on a dashboard.
The dashboard is really cool because it gives you a visual representation of where you're at with so many of your data points. You can then use that to drive decisions on strategies gauging how you’re tracking towards goals and where or when you need to change course.
If you are in Salesforce and you don't currently have your dashboards tab visible or you don't see a dashboard on your homepage, LET’S CHAT, because you're missing out on some really fun components.
With permission, I took a screen shot of a couple of my clients’ dashboards. I privatized as much information as possible, so we can keep them anonymous, but I just wanted to show you some of the things that are possible when you have really fun and exciting dashboards.
Let’s take a look!
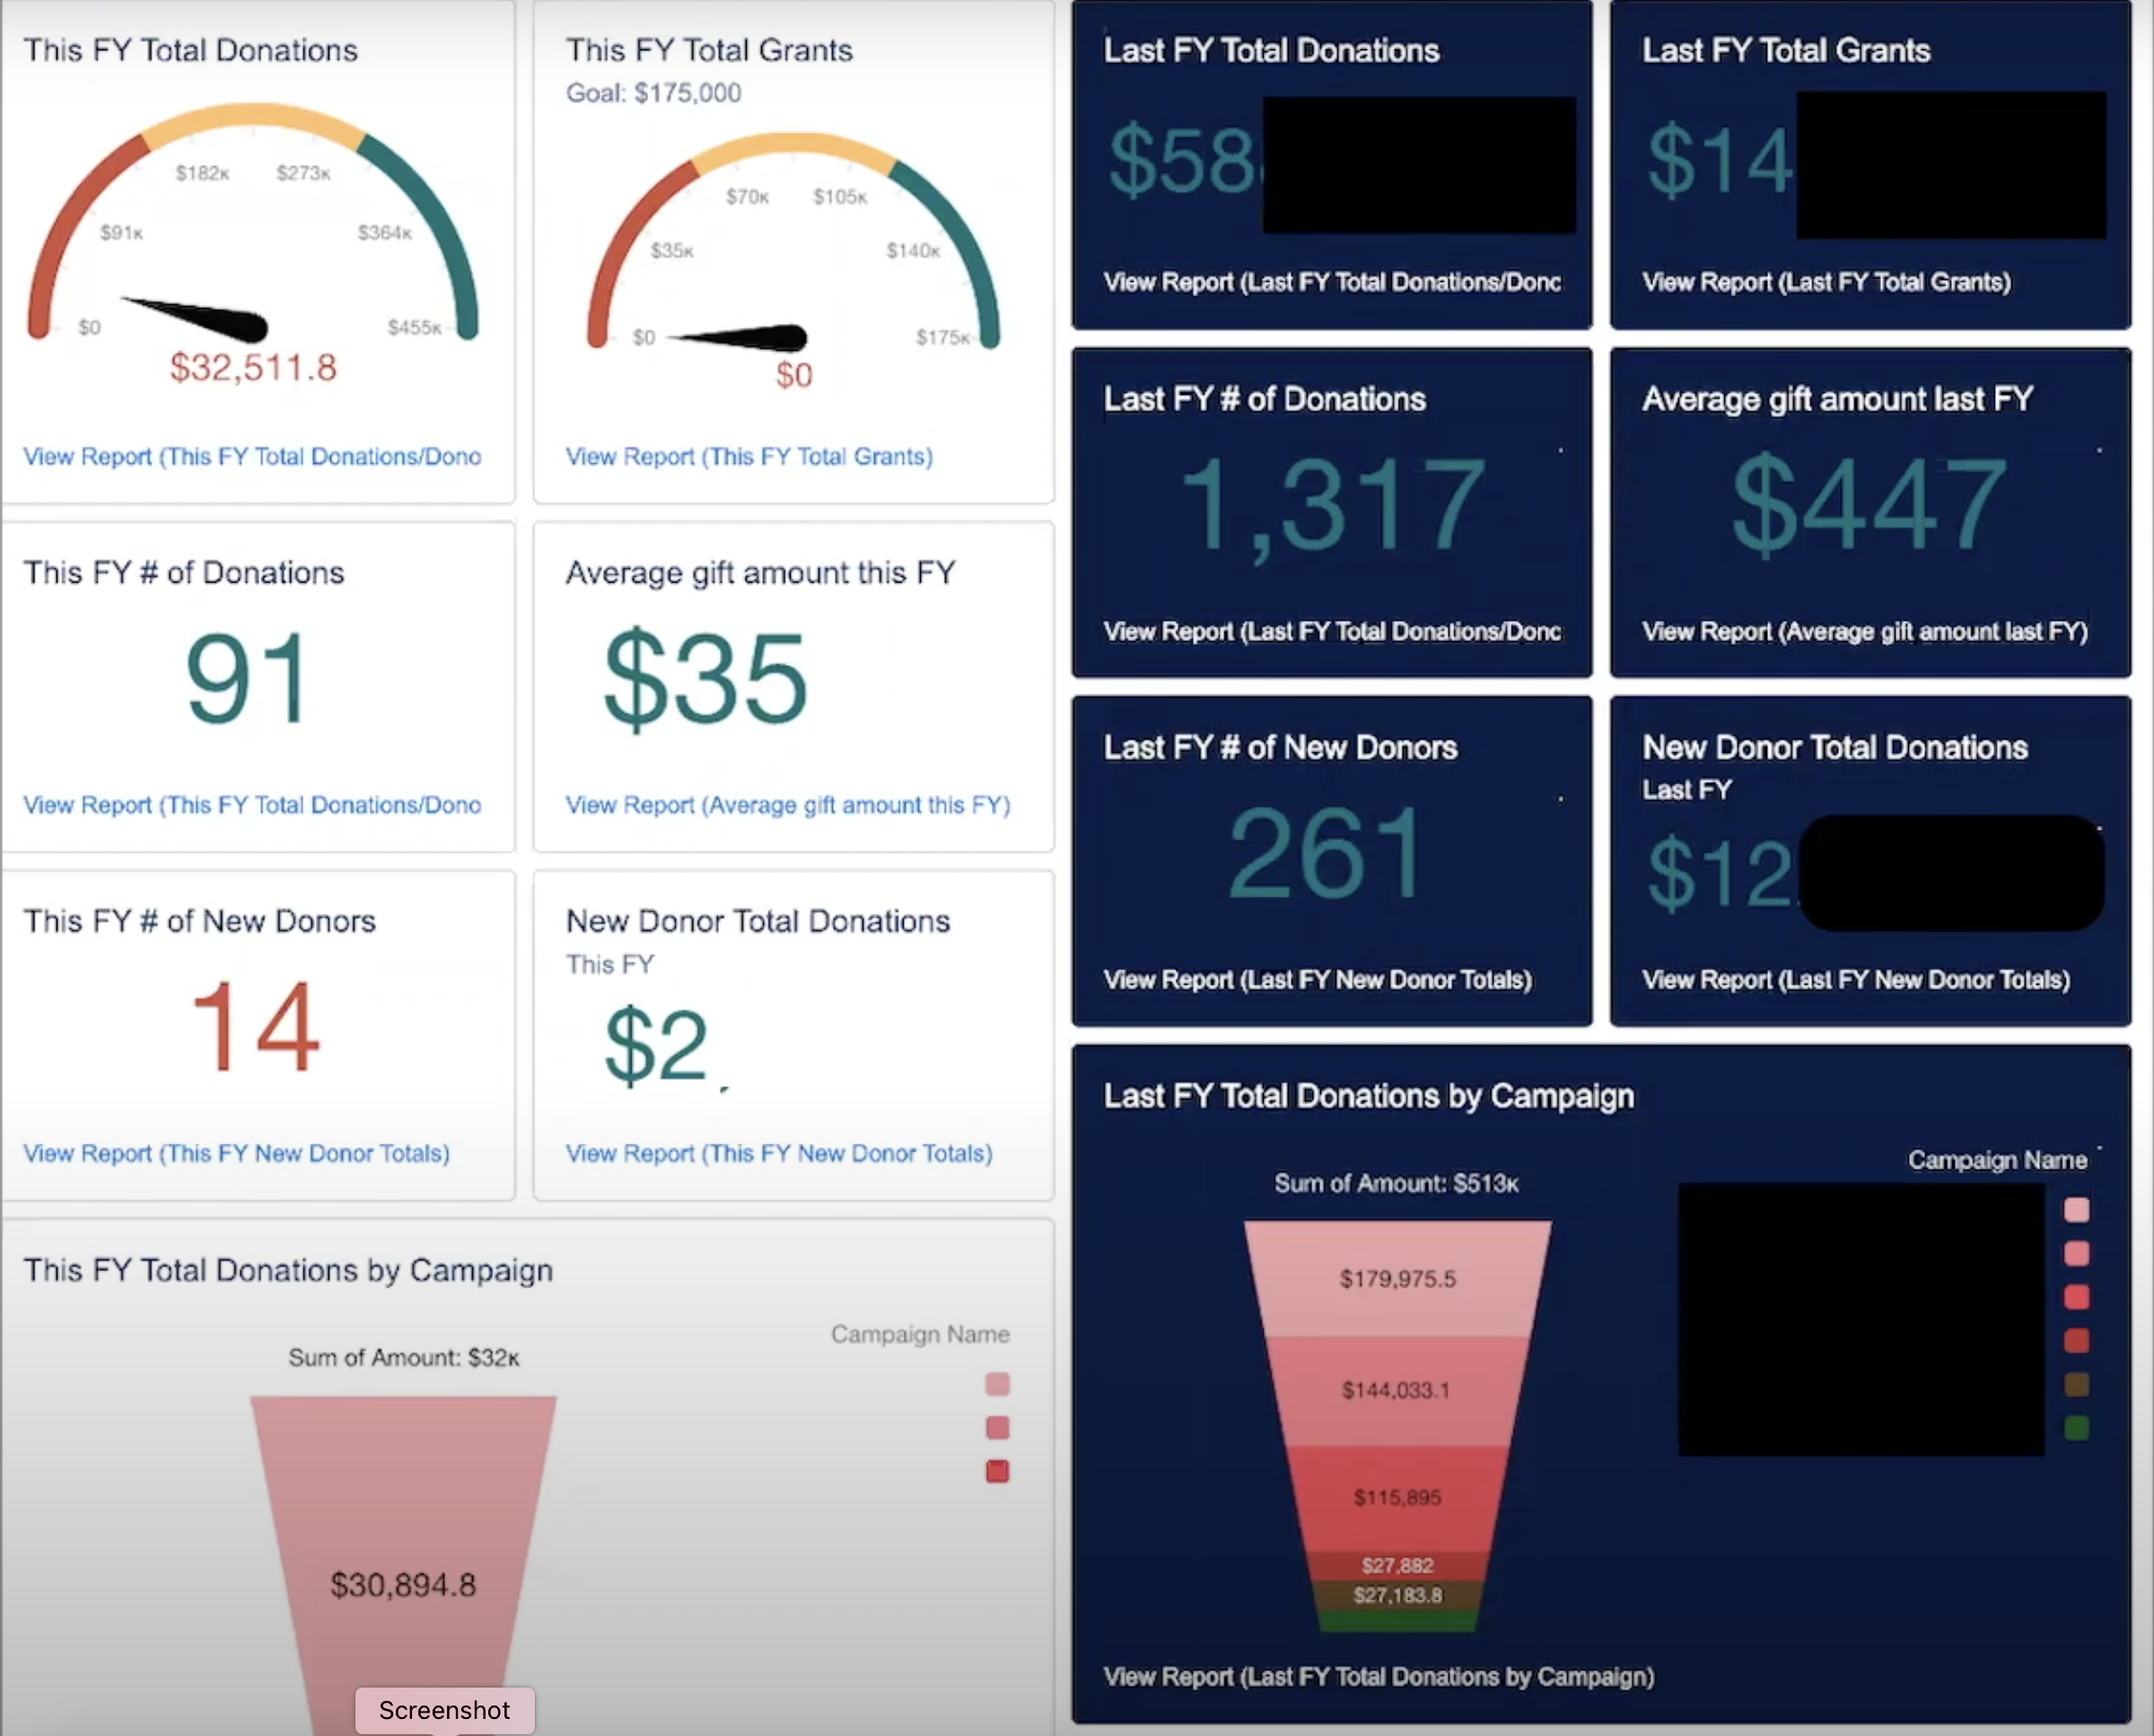
All three of these dashboards focus on fundraising metrics, but you can also use them for data hygiene, patients/client data, volunteer goals, and program metrics. You can use them for any component that you're tracking in Salesforce. I'm just focusing on fundraising in this blog.
Here we can see how they're tracking toward their fundraising goal, how many donors they have, total donations, and various campaign results. Something this image doesn’t show is the month over month progress chart.
Just having a really quick glance on of your different fundraising metrics can not only be a really interesting way to see your data, but also help give you a quick snapshot of where you’re tracking ahead or behind.

This next nonprofit actually has a dashboard that is for their leadership team only, and they wanted to combine fundraising information along with patient information. So they have donations represented, the number of patients they serve, how many people are in research studies, and where their patients are from. It's a cool dashboard that shows you how you can combine different sources of information to get a quick view of updates from across various data sources.

The last one I'll share is a much more simplistic version of a dashboard. This is a smaller nonprofit. We took great advantage of the system available and they can quickly see how much they raised by campaign, outstanding pledge balances, board members and what their give and get totals are, and tracking recurring monthly donors.
Reviewing all of the different KPIs and metrics that you have on your list and figuring out how to track that data will help you create your dashboard.
What Excel reports are you constantly pulling? What are you constantly trying to report out to your board, to your development committee, to your internal team at your team meetings?
Turn those data points into some fun dashboards that can actually make looking at the data easier to process and a little bit more exciting when you hit those goals.
If you want more information on setting up Dashboards in your system,
let's chat. I'd love to help you get going.
Looking for monthly tips, news and updates
to make your organization more successful?
Watch a video of this blog below!